Do you have a website and you would like to improve your user experience? Are you looking for a tool like Hotjar, that allows you to analyze the usability of your blog, e-commerce or landing page?
Great, because in this article we are going to talk about one of the most used tools to check how users behave on your website, and how from here, you can improve the ux design of your site.
Are you ready? So let's do this!
What is Hotjar?
Hotjar is the reference tool for analysis of how much good the user experience of your website. That is why many webmasters or departments specializing in user experience, make use of this platform semi-free, to be able to draw conclusions that directly affect their ux design.
And now comes the million dollar question: how And why should I have to have this tool in my kit of tools seo marketing?
The answer is clear: If you want to improve the transaction of your website (that is to say, to earn more money with your website), to have this tool connected to your site is essential.
How does it work Hotjar?
Hotjar as such, it is a tool that preaches by example, and that is that its operation is extremely simple and intuitive.
Since its online platform (i.e., that it is not necessary to download any software), you'll be able to see how users interact once they are within your website, and as well as being able to see the areas that they frequent.
All of this, we will be of great utility to see which parts of the website work, and what not:
- What the user gets stuck in a form? This may mean that there is an error or bug that prevents to complete the process.
- Do only 20% of users reaches to the middle of the page? Perhaps we should re-organize the content, and upload the one you want at the top.
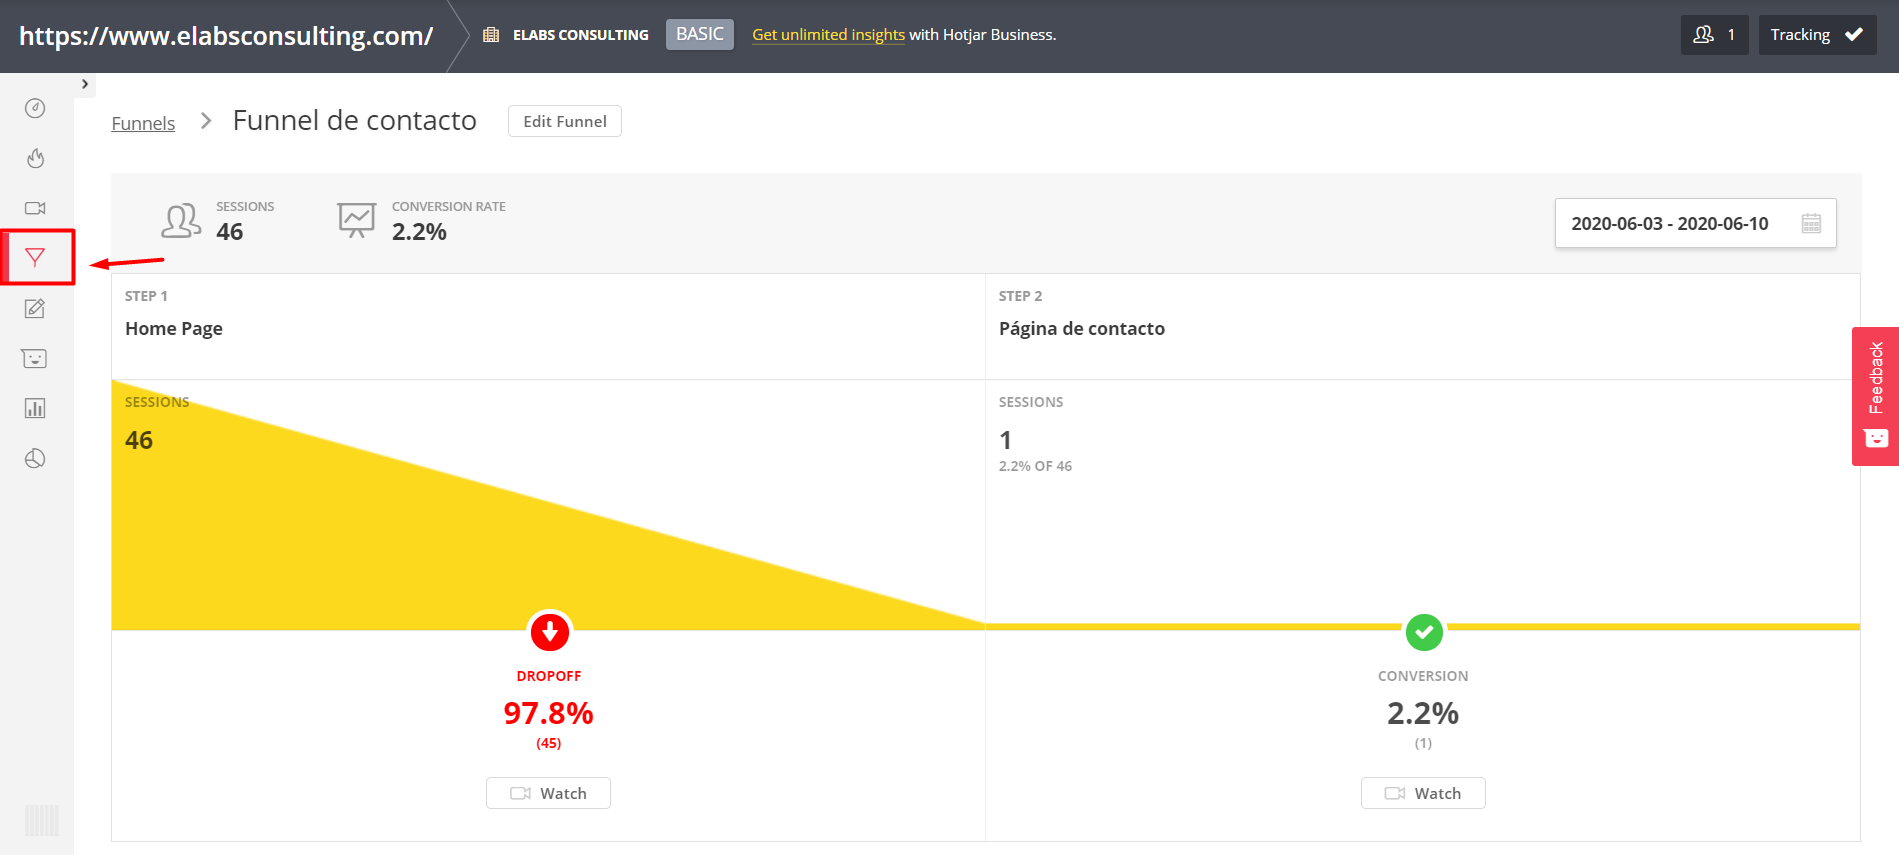
- How we create a funnel of 4 steps, and in step 3, there is a drop-off of the 90%? There are something that we have to check on that step.
There are many factors by which a user can decide to leave the site. That is why we have specific functionalities to catch every problem, and thus be able to implement the most optimal solution.
Main features of Hotjar
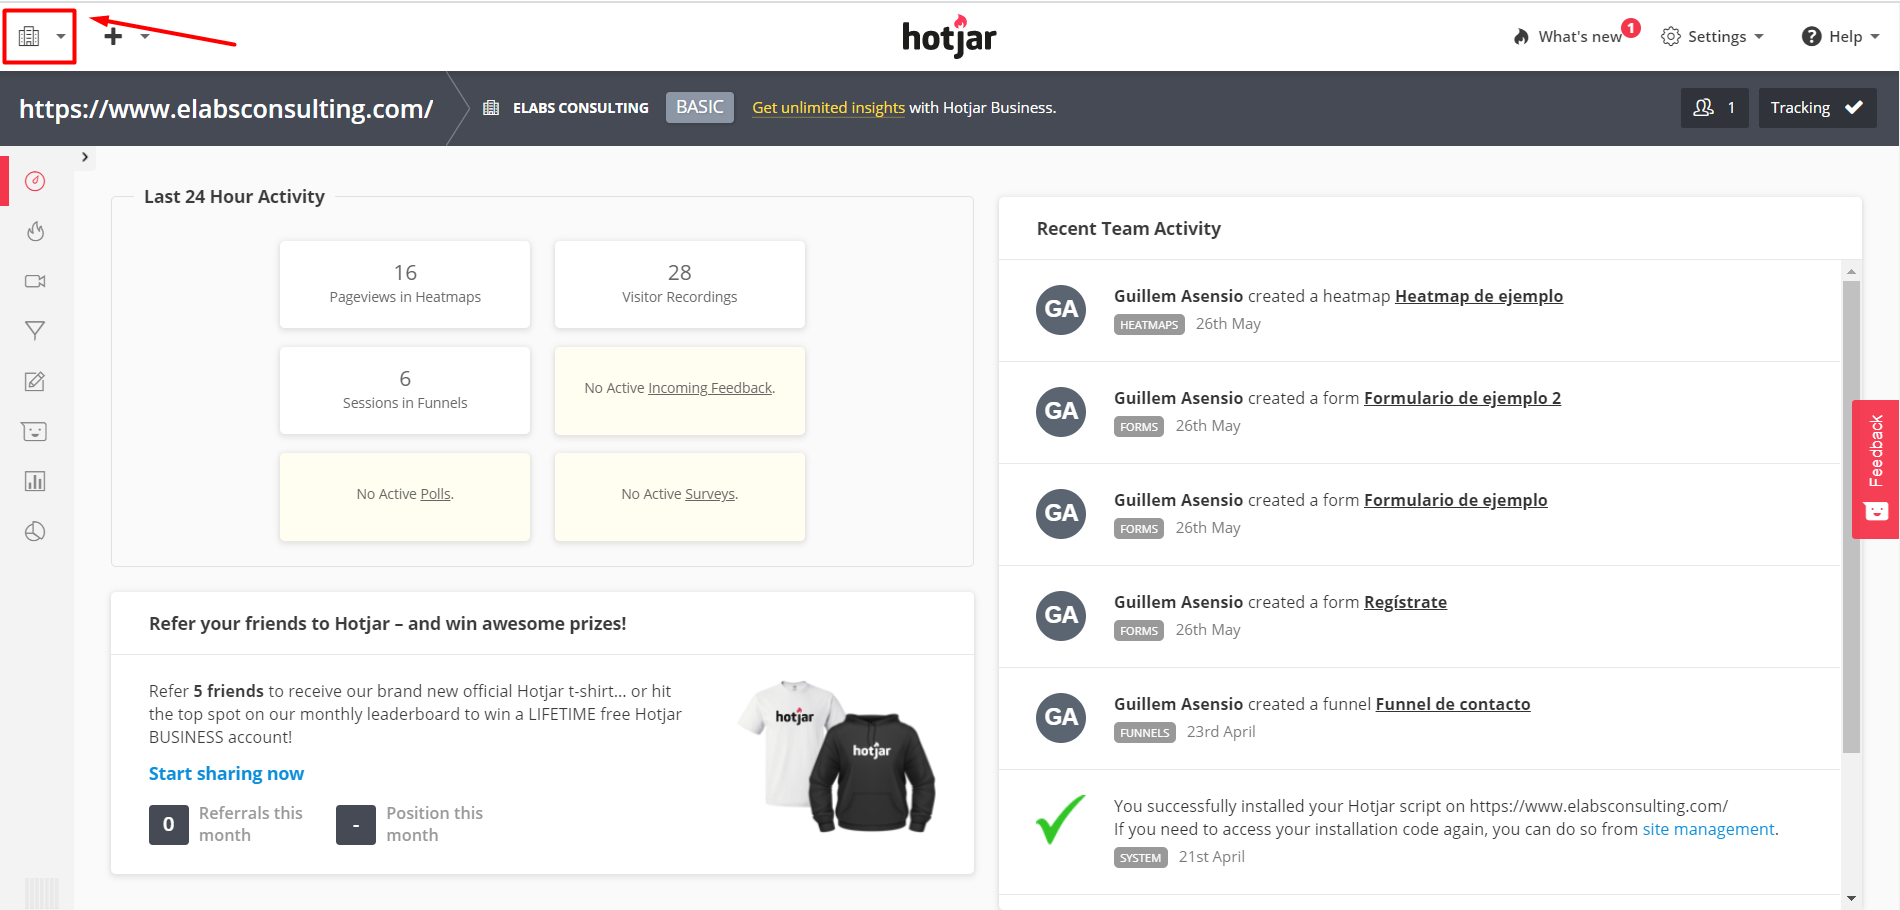
Dashboard or main panel
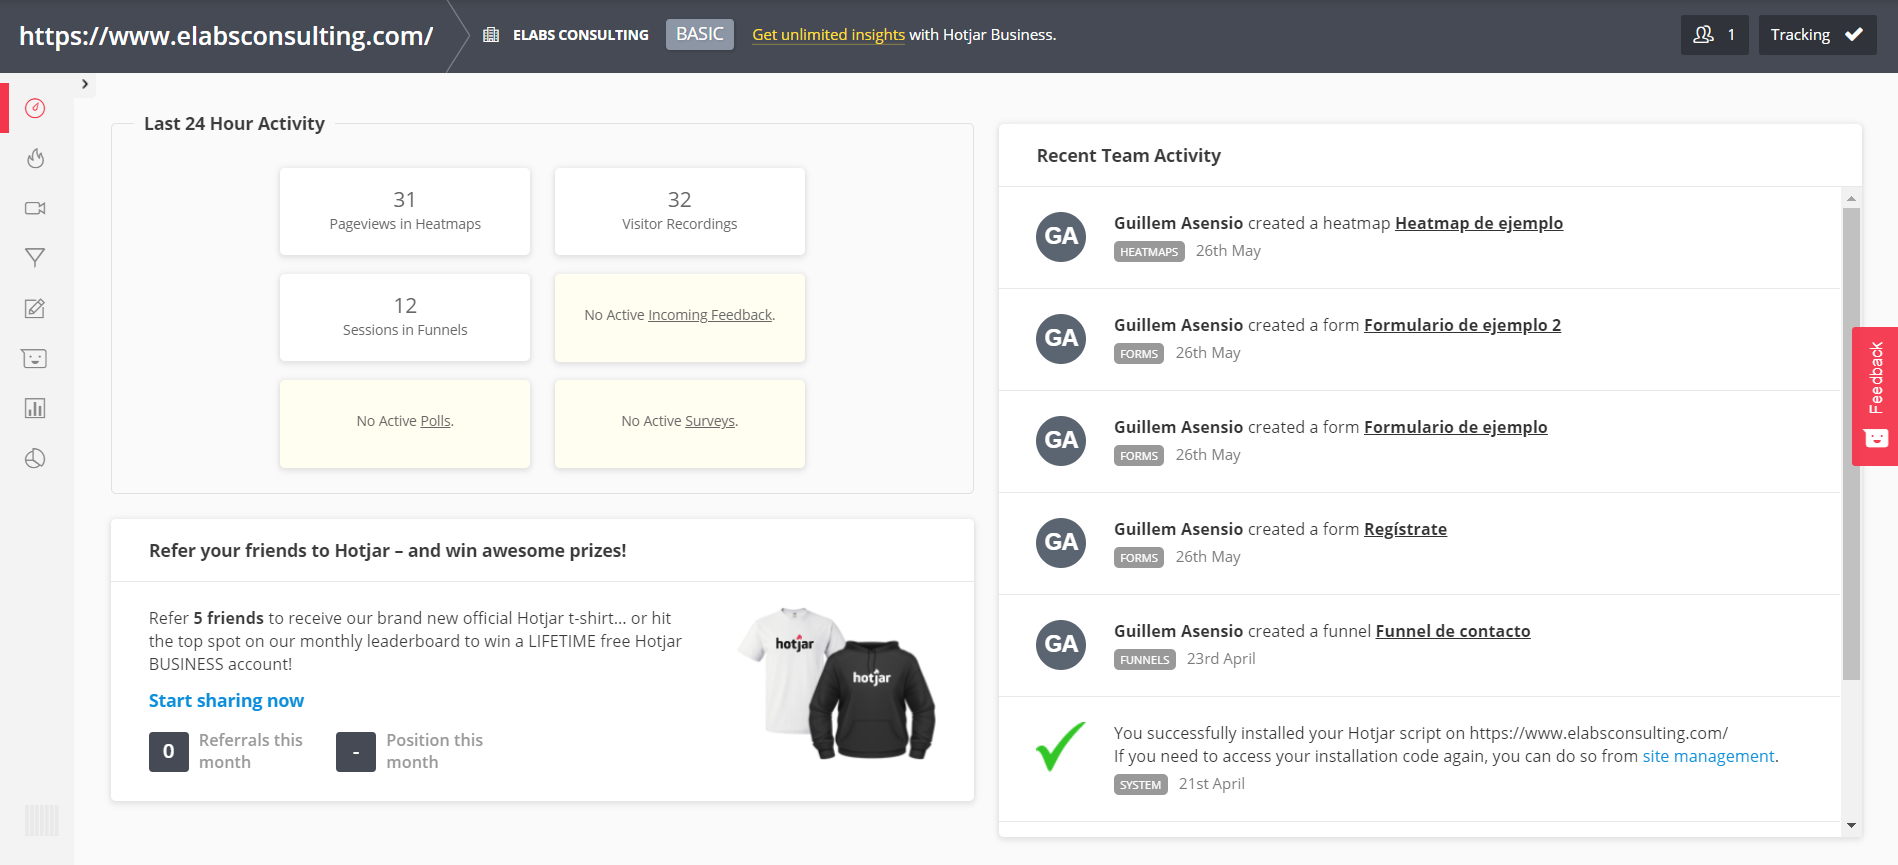
This is the main screen that you're going to find just log in to your account. In it, we always have the updated data of your website for the last 24 hours of activity.
Also, if you share Hotjar between our team, or company, we will be able to see the updates of the most recent activity.
Heatmaps
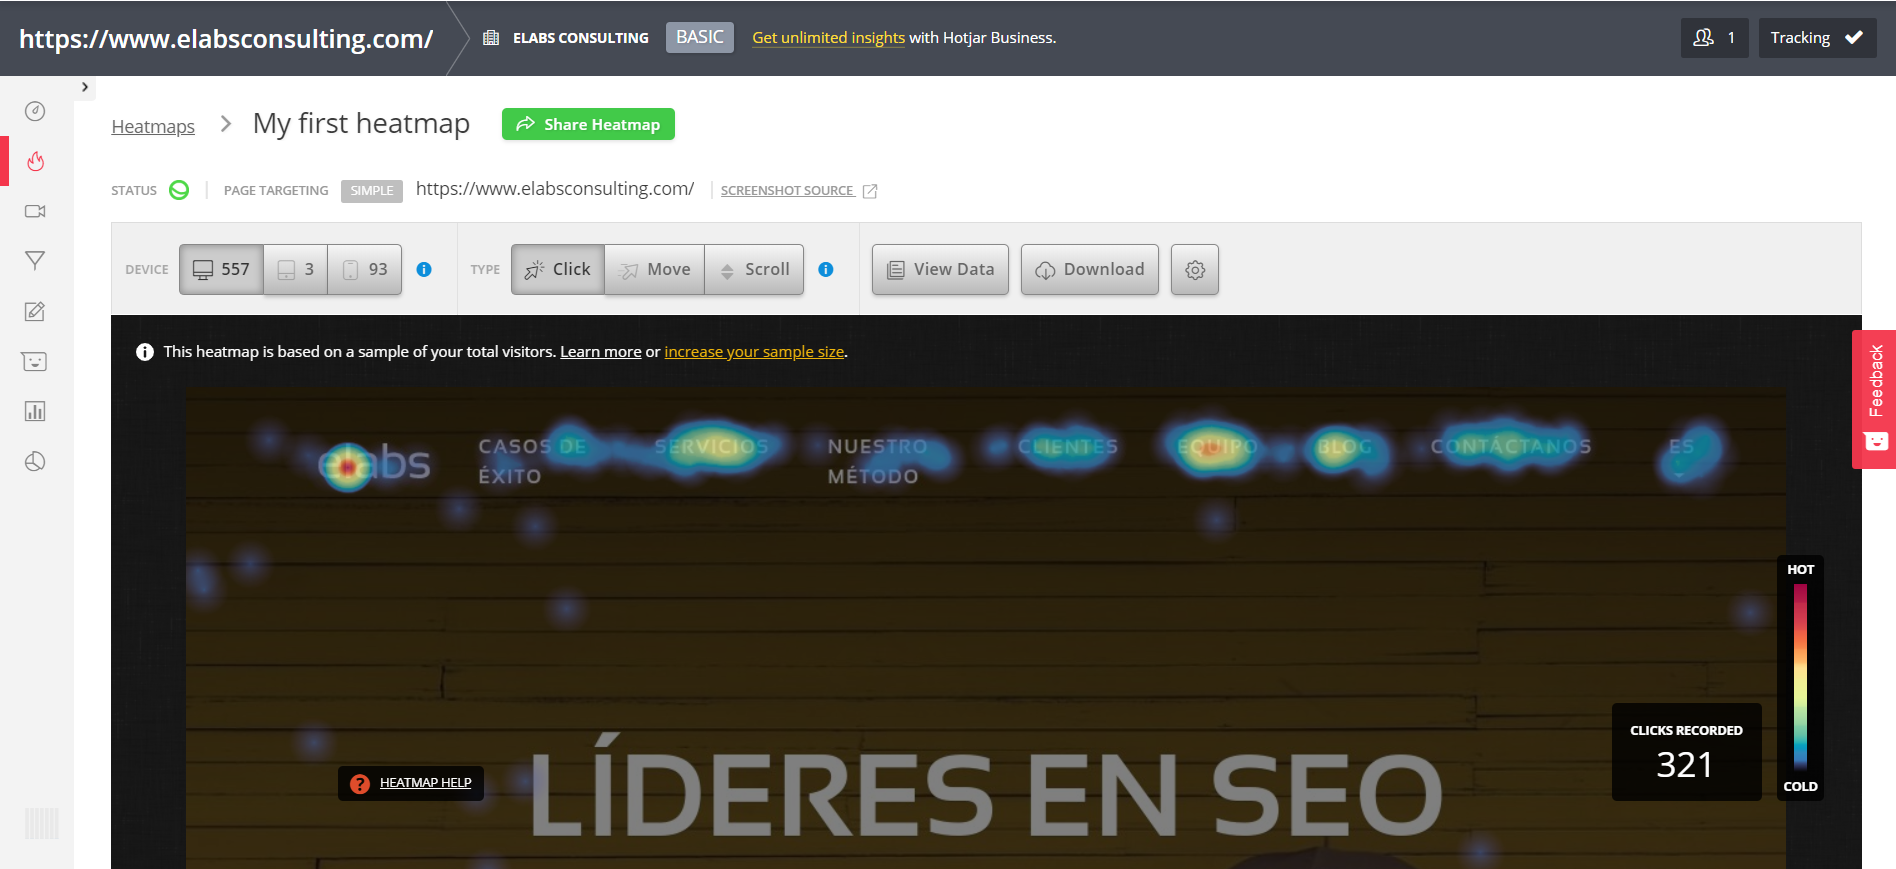
This is the first feature that Hotjar provides us (and one of the most powerful that it gives us in its free version).
It gives us the possibility to create a heatmap or heatmap, the page or pages that we prefer.
And here comes the interesting thing:
We can go making combinations depending on the devices that we want to analyze, or according to the mode of heat map that we want to see the behavior of the user:
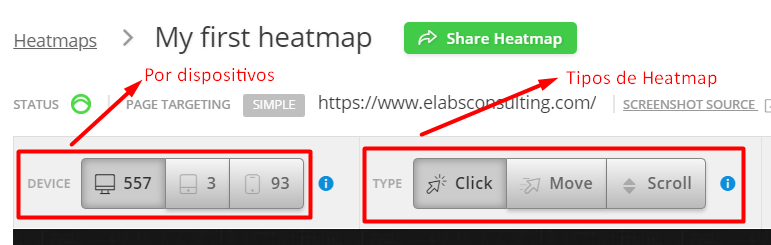
These are the advantages and benefits of each of the types of heatmap that Hotjar offers us:
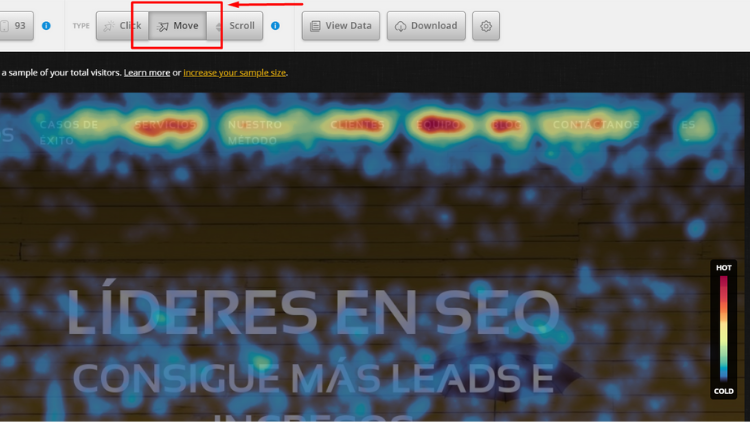
Heatmap click
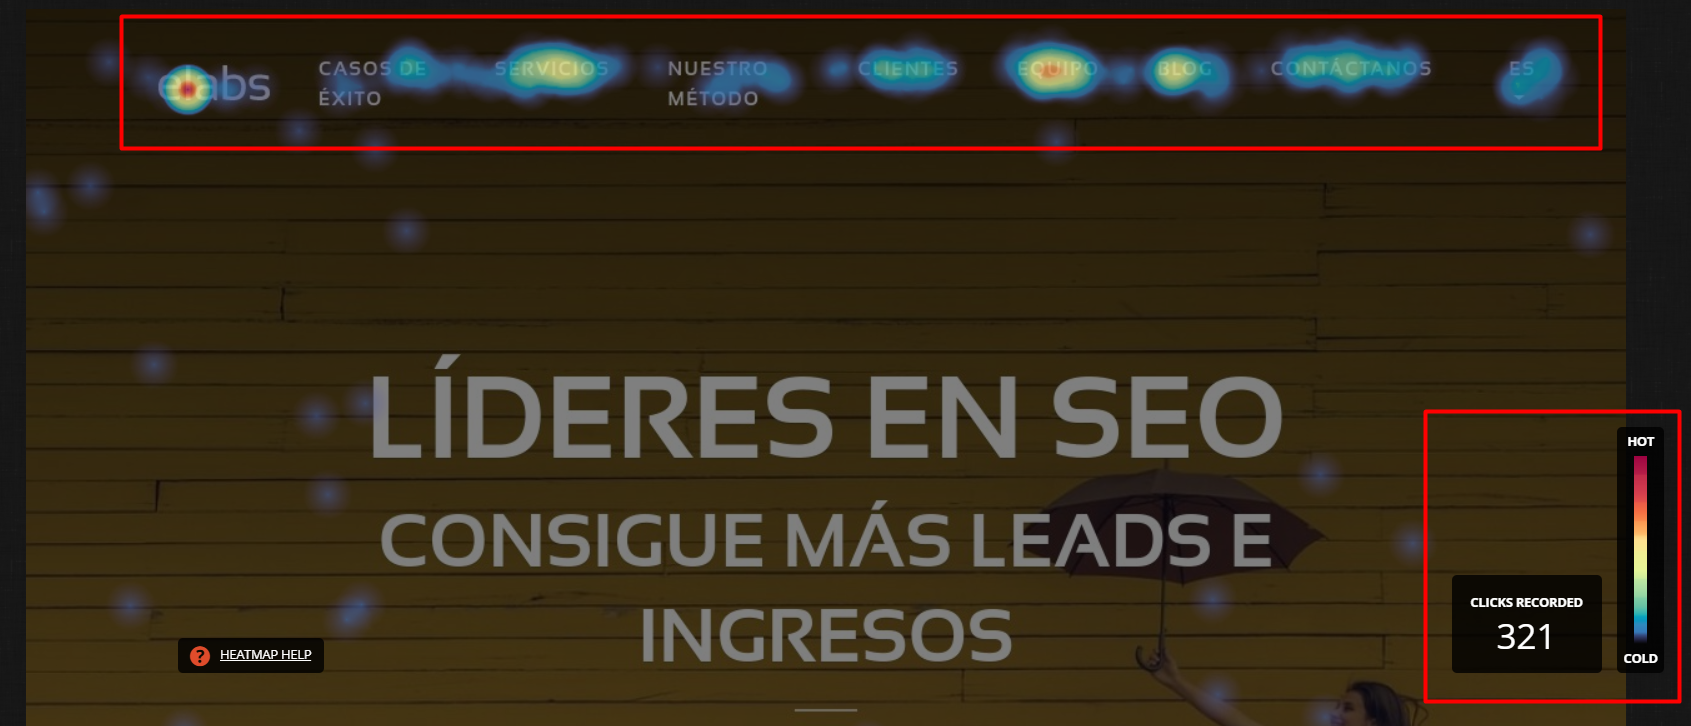
This is the first type of analysis, Hotjar offers us, to be able to analyze the hotter areas of the page. To do this, it serves to collect data on the number of clicks that users make on the page that we are trackeando.
As we can see, how the greater is the intensity of clicks on a zone or button in particular, the hotter the color is.
To know the meaning of each color, to low, to the right we have a legend that gives us more information about the popularity of clicks that area, as well as the number of users who have clicked on the page.
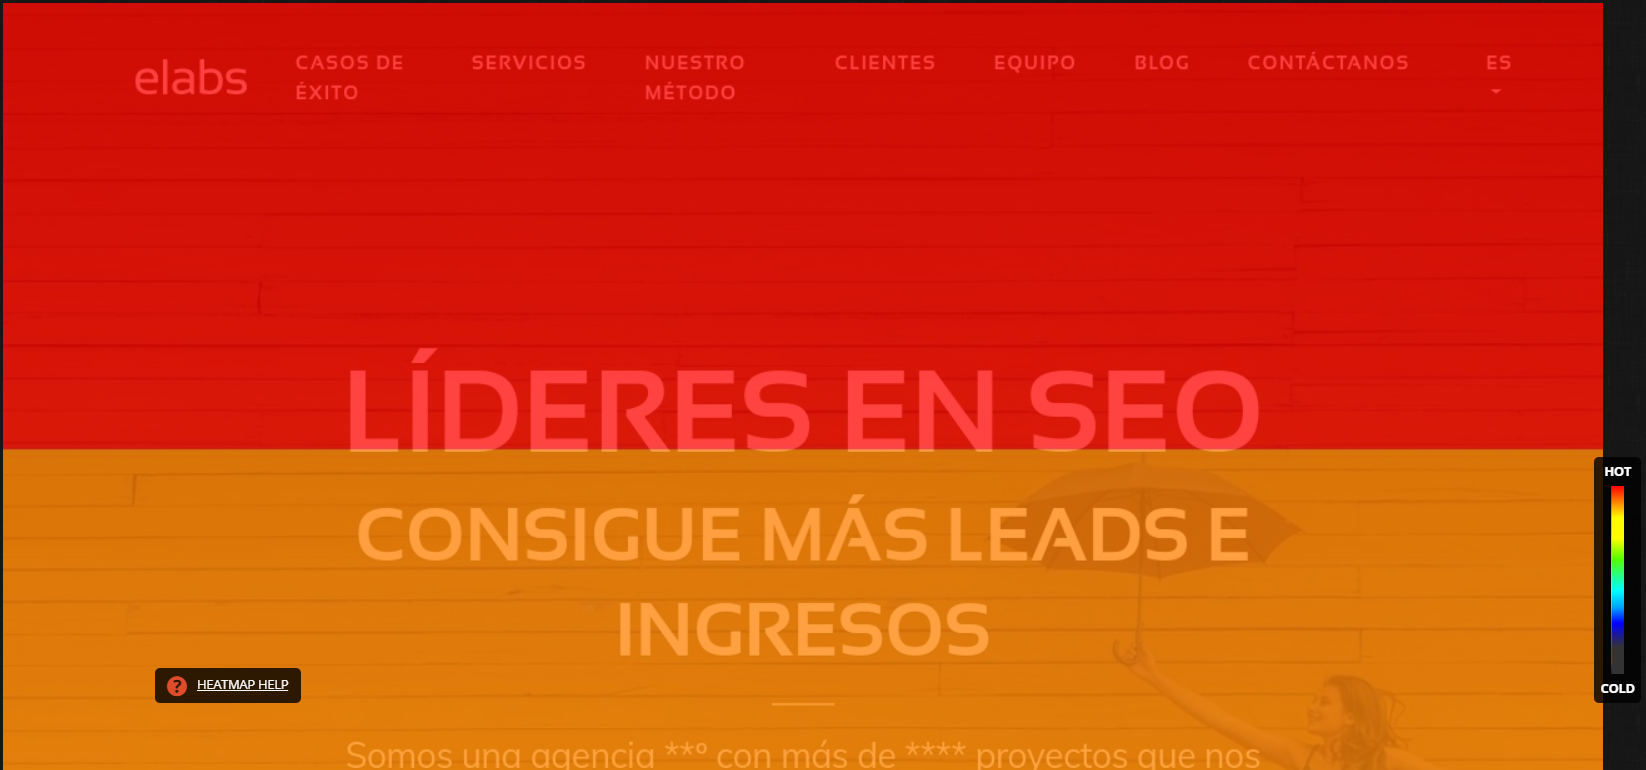
Heatmap of movement
In this second functionality, the heatmap or heatmap is no longer based on the clicks made by the user, but in the movement of the mouse.
And this is a very important point to keep in mind, because by using this functionality, we can know what he has captured more attention to the user, because they will automatically move the mouse wherever we go looking.
So, if we look closely, since not all concentrated in sections from the top menu, but we also see the attention a little bit more distributed toward the center of the screen.
Note: This funacionalidad is not available on mobile or tablet, for the simple reason that such devices there is no mouse.
Heatmap scroll
Finally, we end with the functionality of heatmap scroll, which we will provide very valuable information, up to where the user navigates along the page that we want to analyze.
To do this, we keep on serving the intensity of colors to under to the right to see the areas warmer and cooler areas of the landing.
This is going to be useful to organize content most important to the height where the user still gets to read. Because if you concentrate the most important sections at the end of the page, the result will be the following:
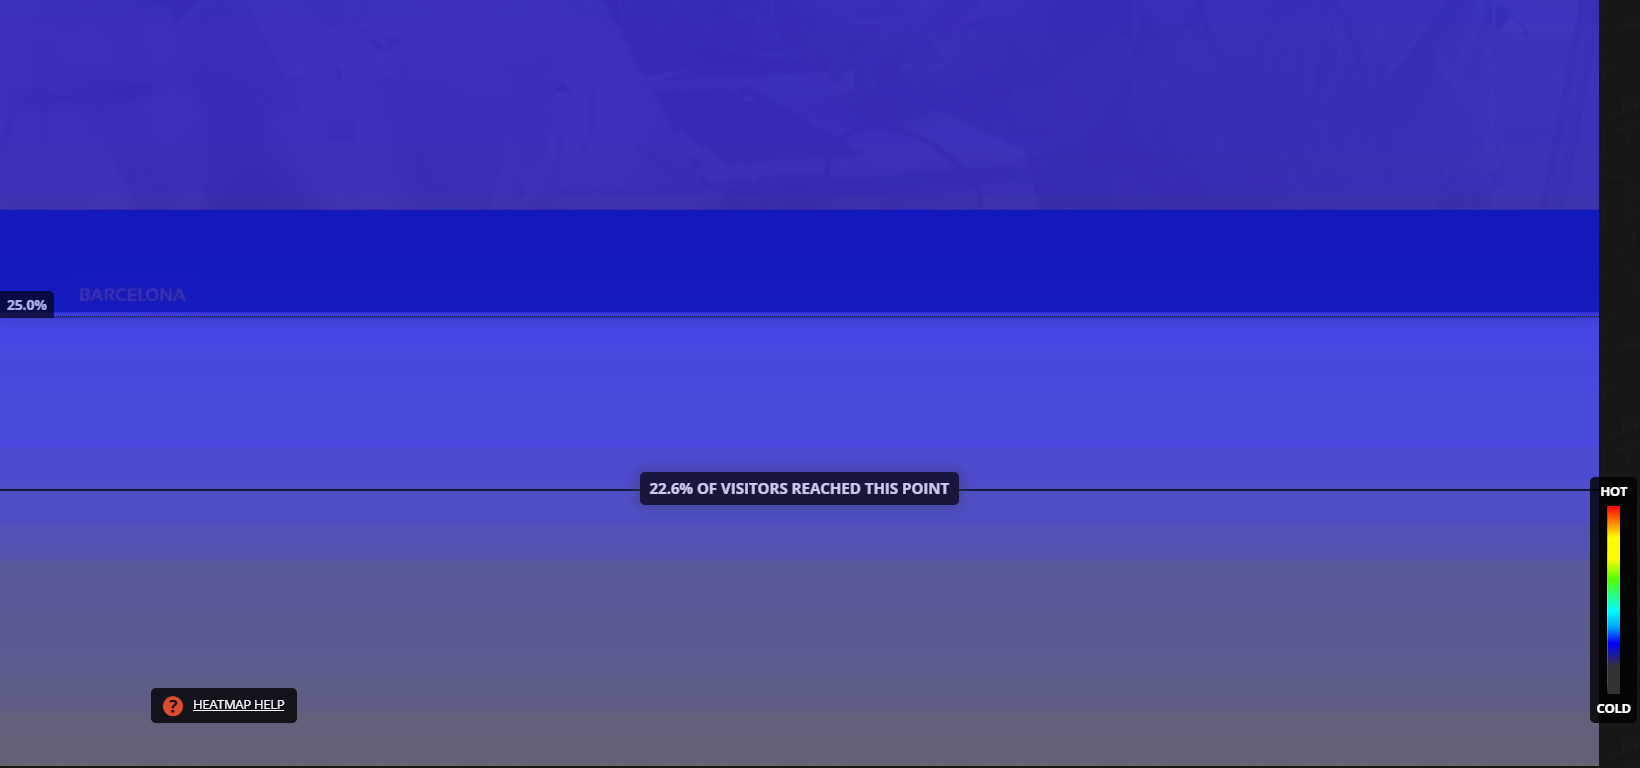
Only 25% of users reach the end of this page. So here we will put the content dispensable, such as the footer, and complementary information but not of vital importance.
Screen recordings or Recordings
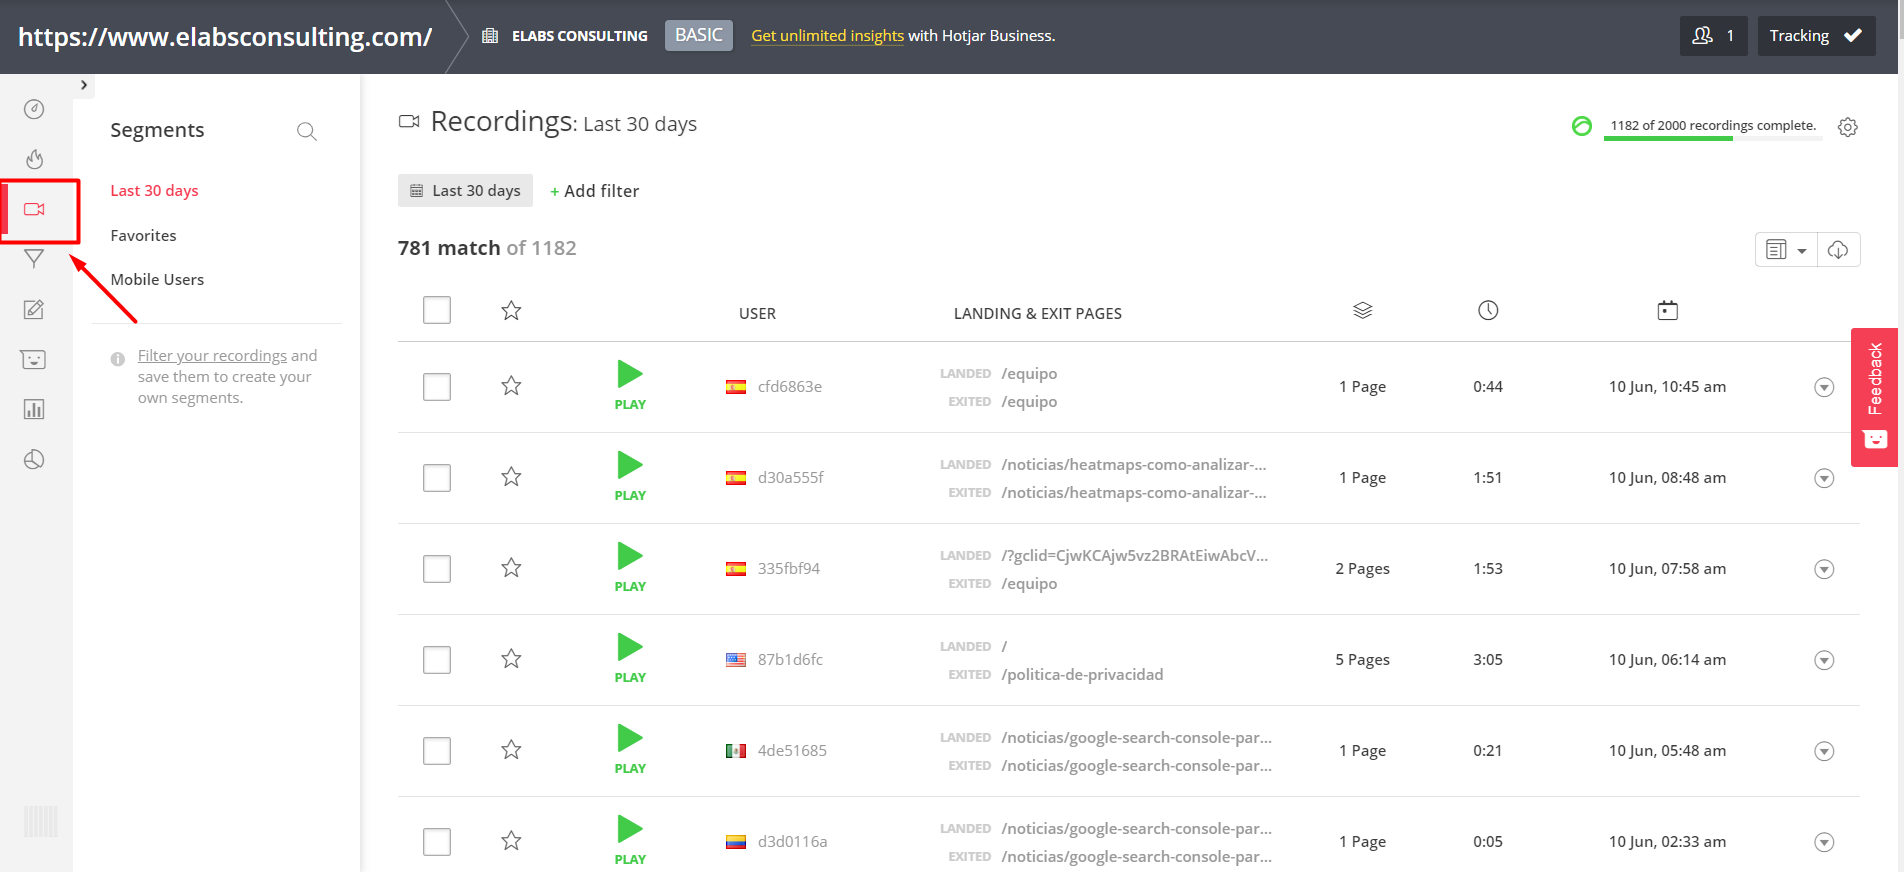
This is the second main functionality that Hotjar offers us, and we will be really helpful to detect patterns of behavior in users, as well as bugs, errors in the page, errors in navigation, load time, etc
And how does it work?
Very simple: accumulate the screen recordings of each individual user (obviously, hiding your personal information, for data protection reasons), and if you go into every one of the recordings, we can see in the exclusive, navigation, real-that has had the user go through our website. This involves the registration of the movement of the mouse, the scroll that has been done, the time which has remained in the website, the pages you have visited...
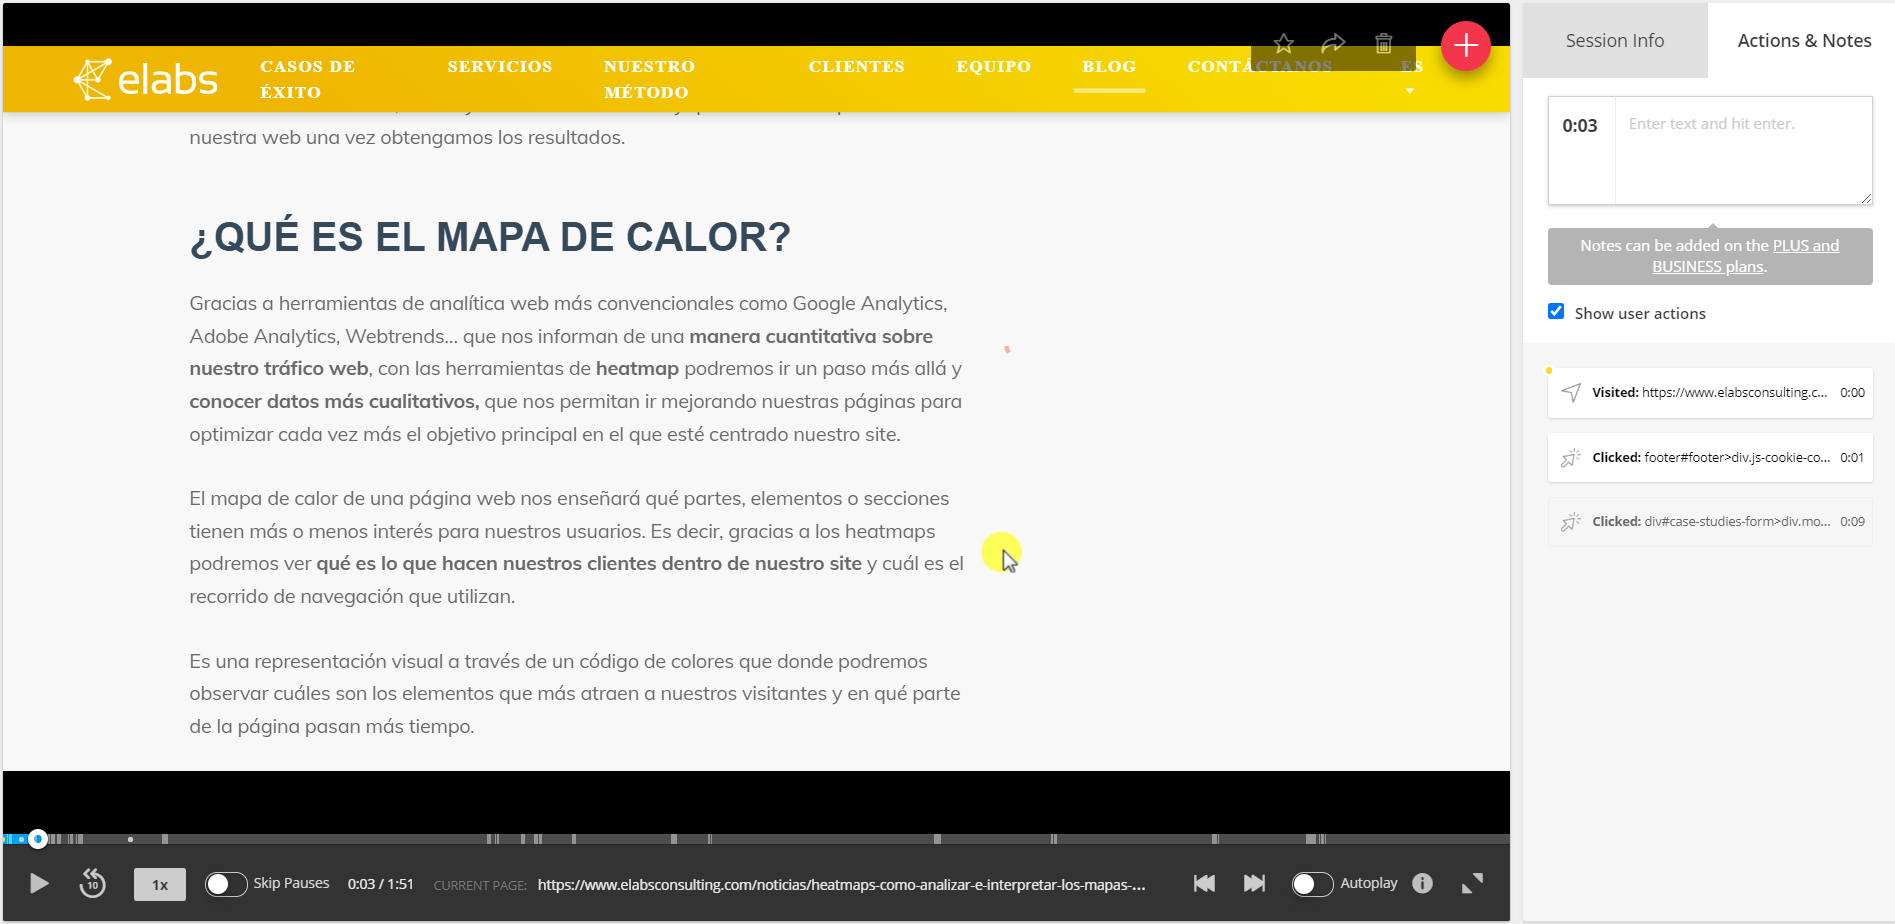
On the bottom bar, we can per the progress of the recording, where it gives us the possibility to change the speed of playback, skip breaks to obviate the moments in which the user has not made any action...
And in the right bar, we have the summary of all of the activity: the pages you visit, the items you have clicked... as well as leave a note in order to be able to report to other members of the team.
Funnels conversion
On the bottom bar, we can per the progress of the recording, where it gives us the possibility to change the speed of playback, skip breaks to obviate the moments in which the user has not made any action...
And in the right bar, we have the summary of all of the activity: the pages you visit, the items you have clicked... as well as leave a note in order to be able to report to other members of the team.
Forms
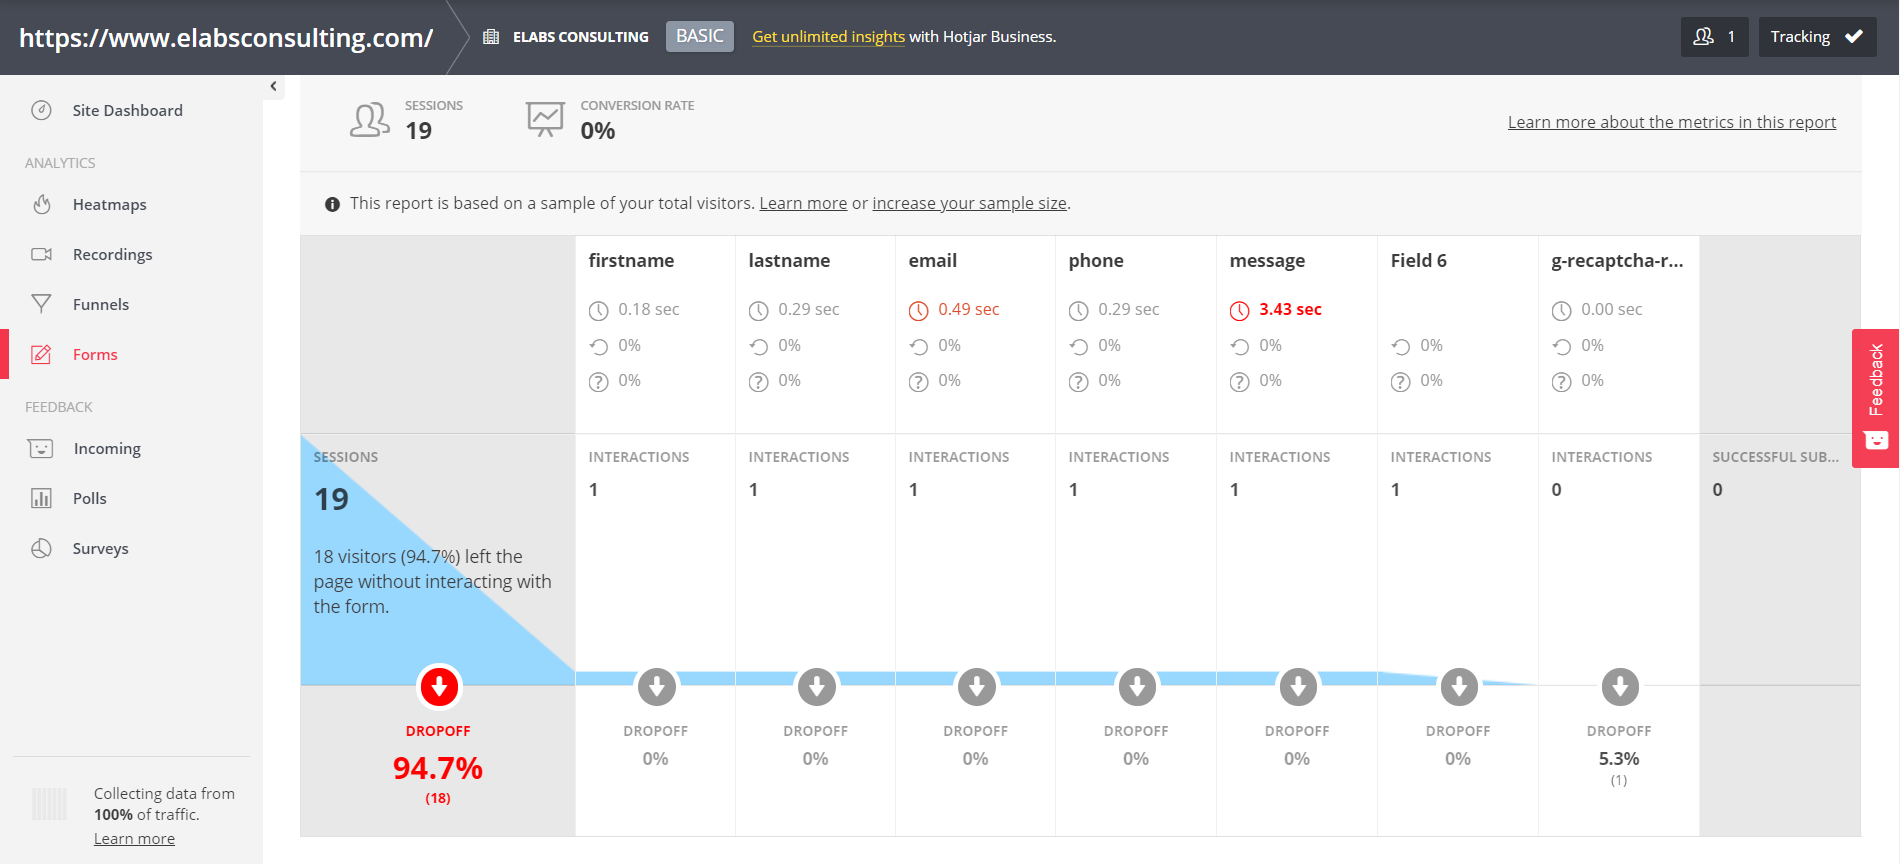
This fourth of functionality, we are going to be used to collect data on how evolves the user throughout the process of enrolling in our web form.
That is to say, we will be able to see information valuable as the time that it takes for a user to fill in every field, how many interactions are there in each field, what is the drop-off or abandonment throughout the form, and finally, all of this will help us to draw conclusions for improvement.
Collect feedback: Incoming, Polls and Surveys
This last section is more focused on embed pop-ups, surveys and methods by which to collect opinions, and assessments of our users about your user experience on our website.
In fact, we can make the kinds of questions that we wanted, and with it to collect feedback that will help us to improve from here on out.
How to connect Hotjar to your webpage?
If you've already convinced that Hotjar is a necessary tool to improve your user experience, and evolve your website to success, then you'll need to know how to connect Hotjar to your website:
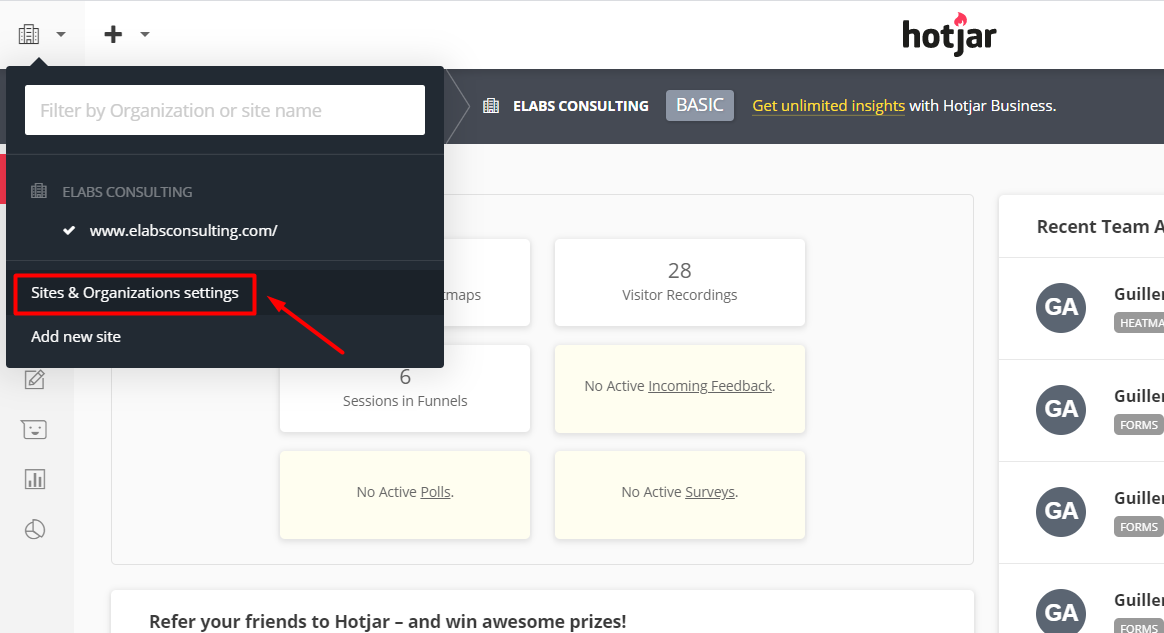
Step 1: Go to the icon of the building (top left)
Step 2: click on “Sites & Organizations settings”
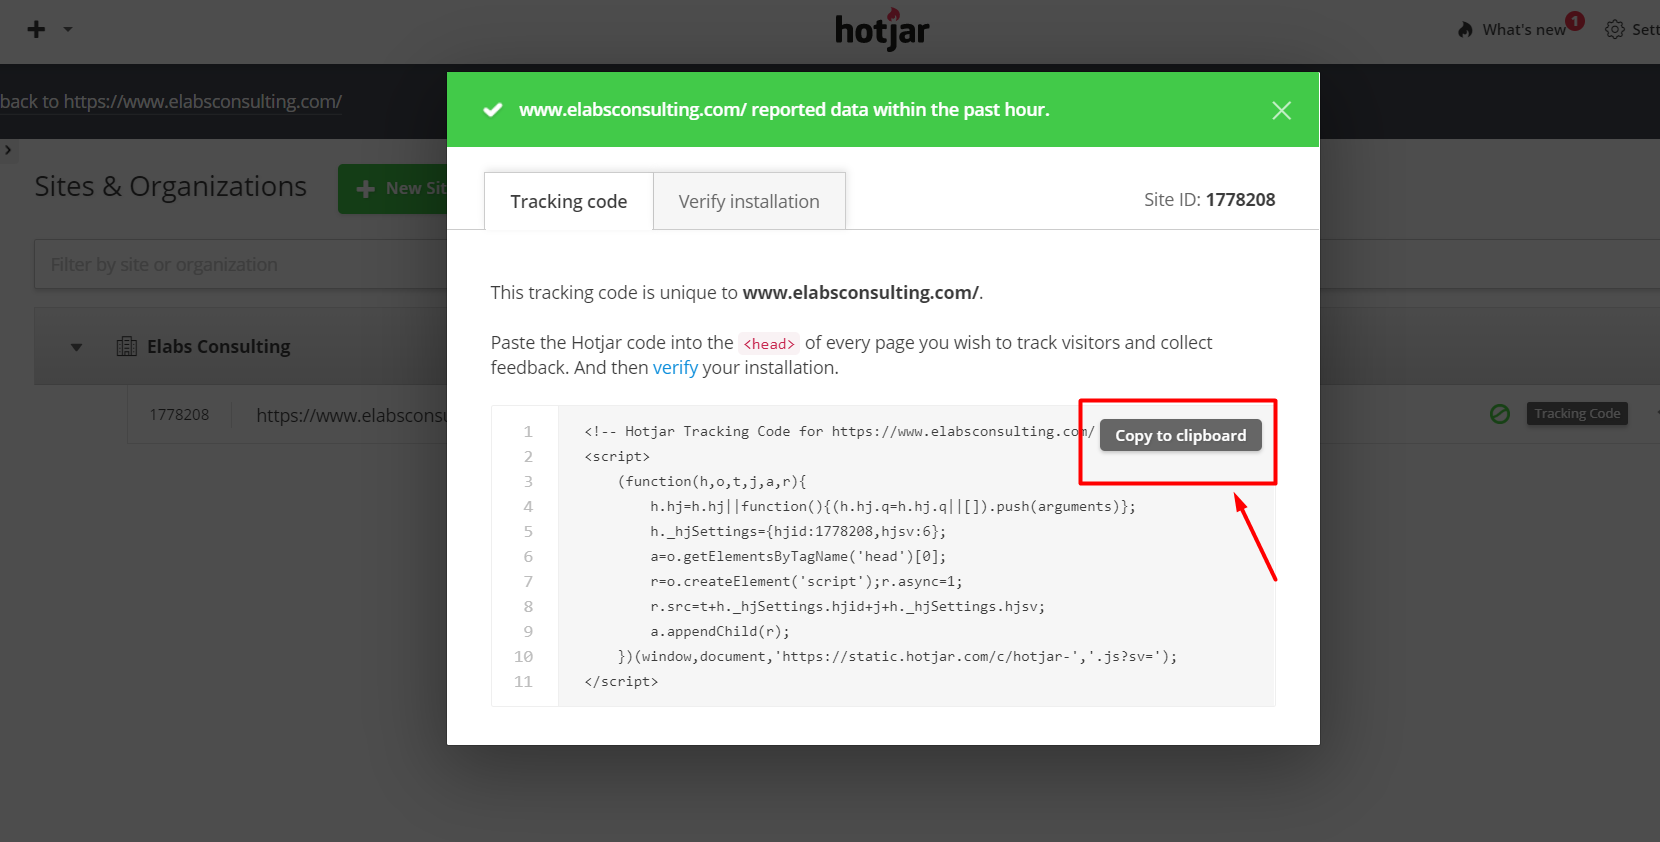
Step 3: Click the button “Tracking code”

Step 4: Copy the code and paste it in between
and
your website (you can also do it via tag manager).
Step 5: once embedded the code, verify that it is well implemented
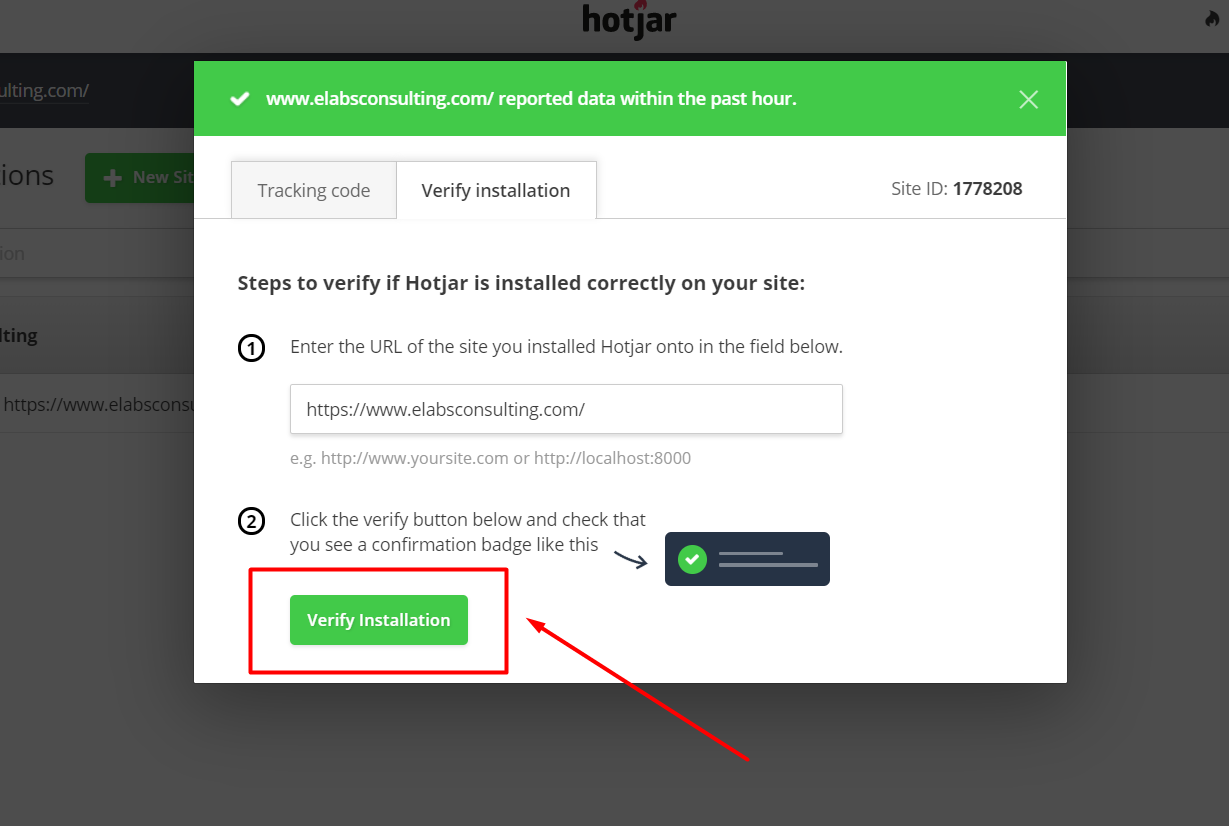
Step 6: If you have done well, you'll see a pop-up check
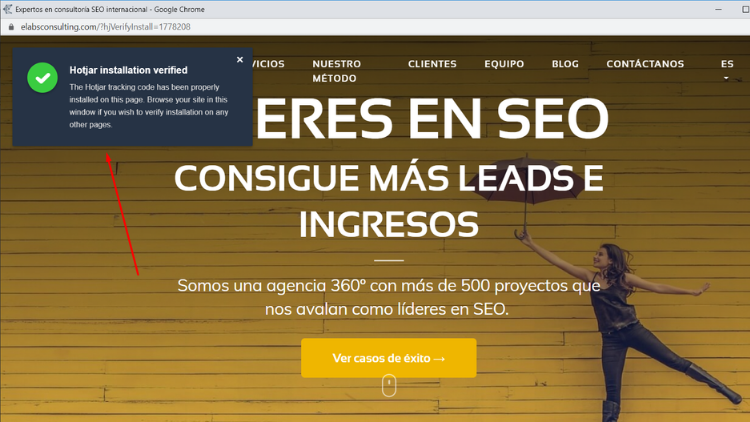
That's all folks!
Hopefully I've been of great help to this post, and that your user experience is better than before.

